TwitterTrails
Role: Project Manager
- Define the project vision and the appropriate roadmap to achieve the vision
- Lead brainstorming, prototyping, and development of a novel interactive D3.js visualization of fake news on Twitter
- Supervised the team working on the development of the D3.js visualization using HTML, CSS, and JavaScript
- Create and present wireframe mockups
- First-authored the case study accepted at the prestigious ACM CHI 2018 conference (45% acceptance rate) and co-authored the workshop paper published at CHI 2017
Time Frame: Fall 2015 && Fall 2017
This project is partially funded by the NSF.
Project Brief
TwitterTrails is a tool that allows members of the media to track the trustworthiness of stories shared on Twitter. The project has examined 457 stories so far. For each story, the algorithm measures how widely the story spread and how skeptical users are about its validity. By measuring crowd behavior, the TwitterTrails algorithm allows journalists to investigate claims and determine whether they appear to be true or false.
Problem Statement
The way people are getting their information and news has changed over the past decade. People have gone from reading news on printed newspaper sources that they trust to reading artciles online. However, the information online is neither verified nor from reliable sources. This has led to a lot of misinformation spreading online, which many argue greatly influenced the 2016 U.S. Presidential Election. As such, there is a need for a sort of "verification" of claims that are made online.
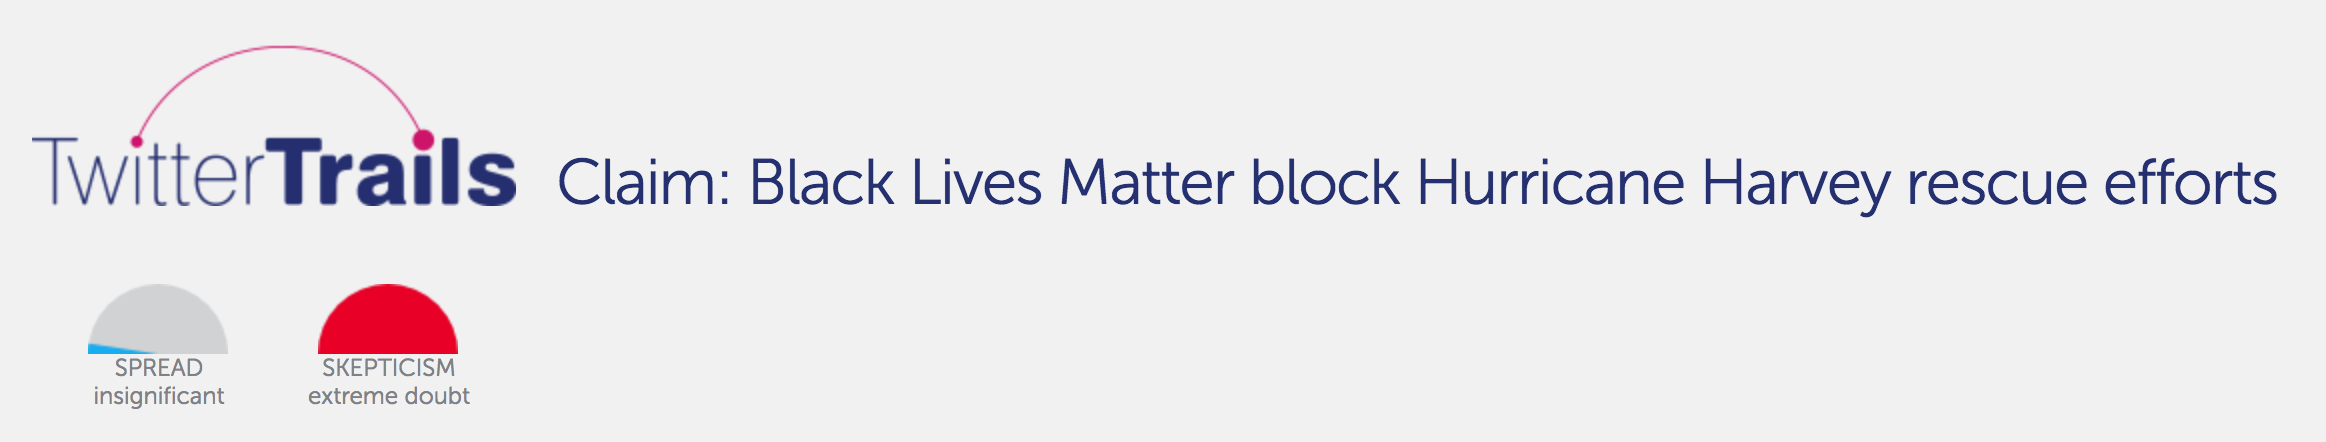
Figure 1. Example of the beginning of a tweet analysis, click here to see more
.This tool aims to solve this problem by investigating Twitter claims that are made online. This is then presented to the user through the visualization of the propagation graph, time series of relevant tweets, co-retweeted network, and the pictures associated with the claim. We are now currently working on presenting this information in a better way through an interactive visualization (as seen in Figure 2).
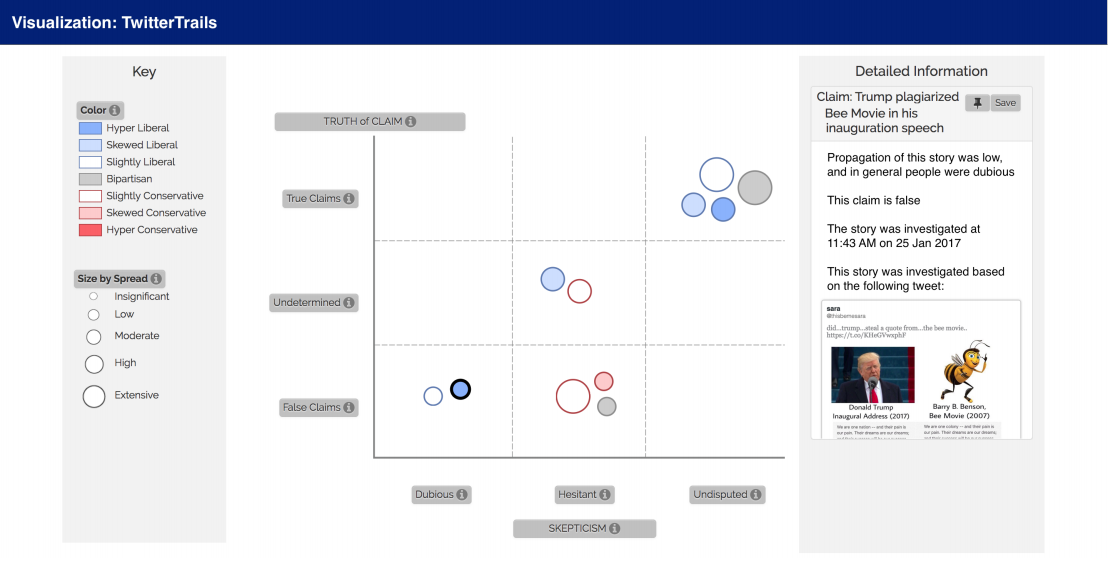
Figure 2. First attempt to visualizing TwitterTrails stories. Each bubble represents a twitter claim or event, plotted by truth of claim and skepticism. When a claim is selected, detailed information about that claim is displayed on the right.
We are now working to create a new visualization of these Twittertrails stories based on the "tags" associated with the story (as seen in Figure 3).
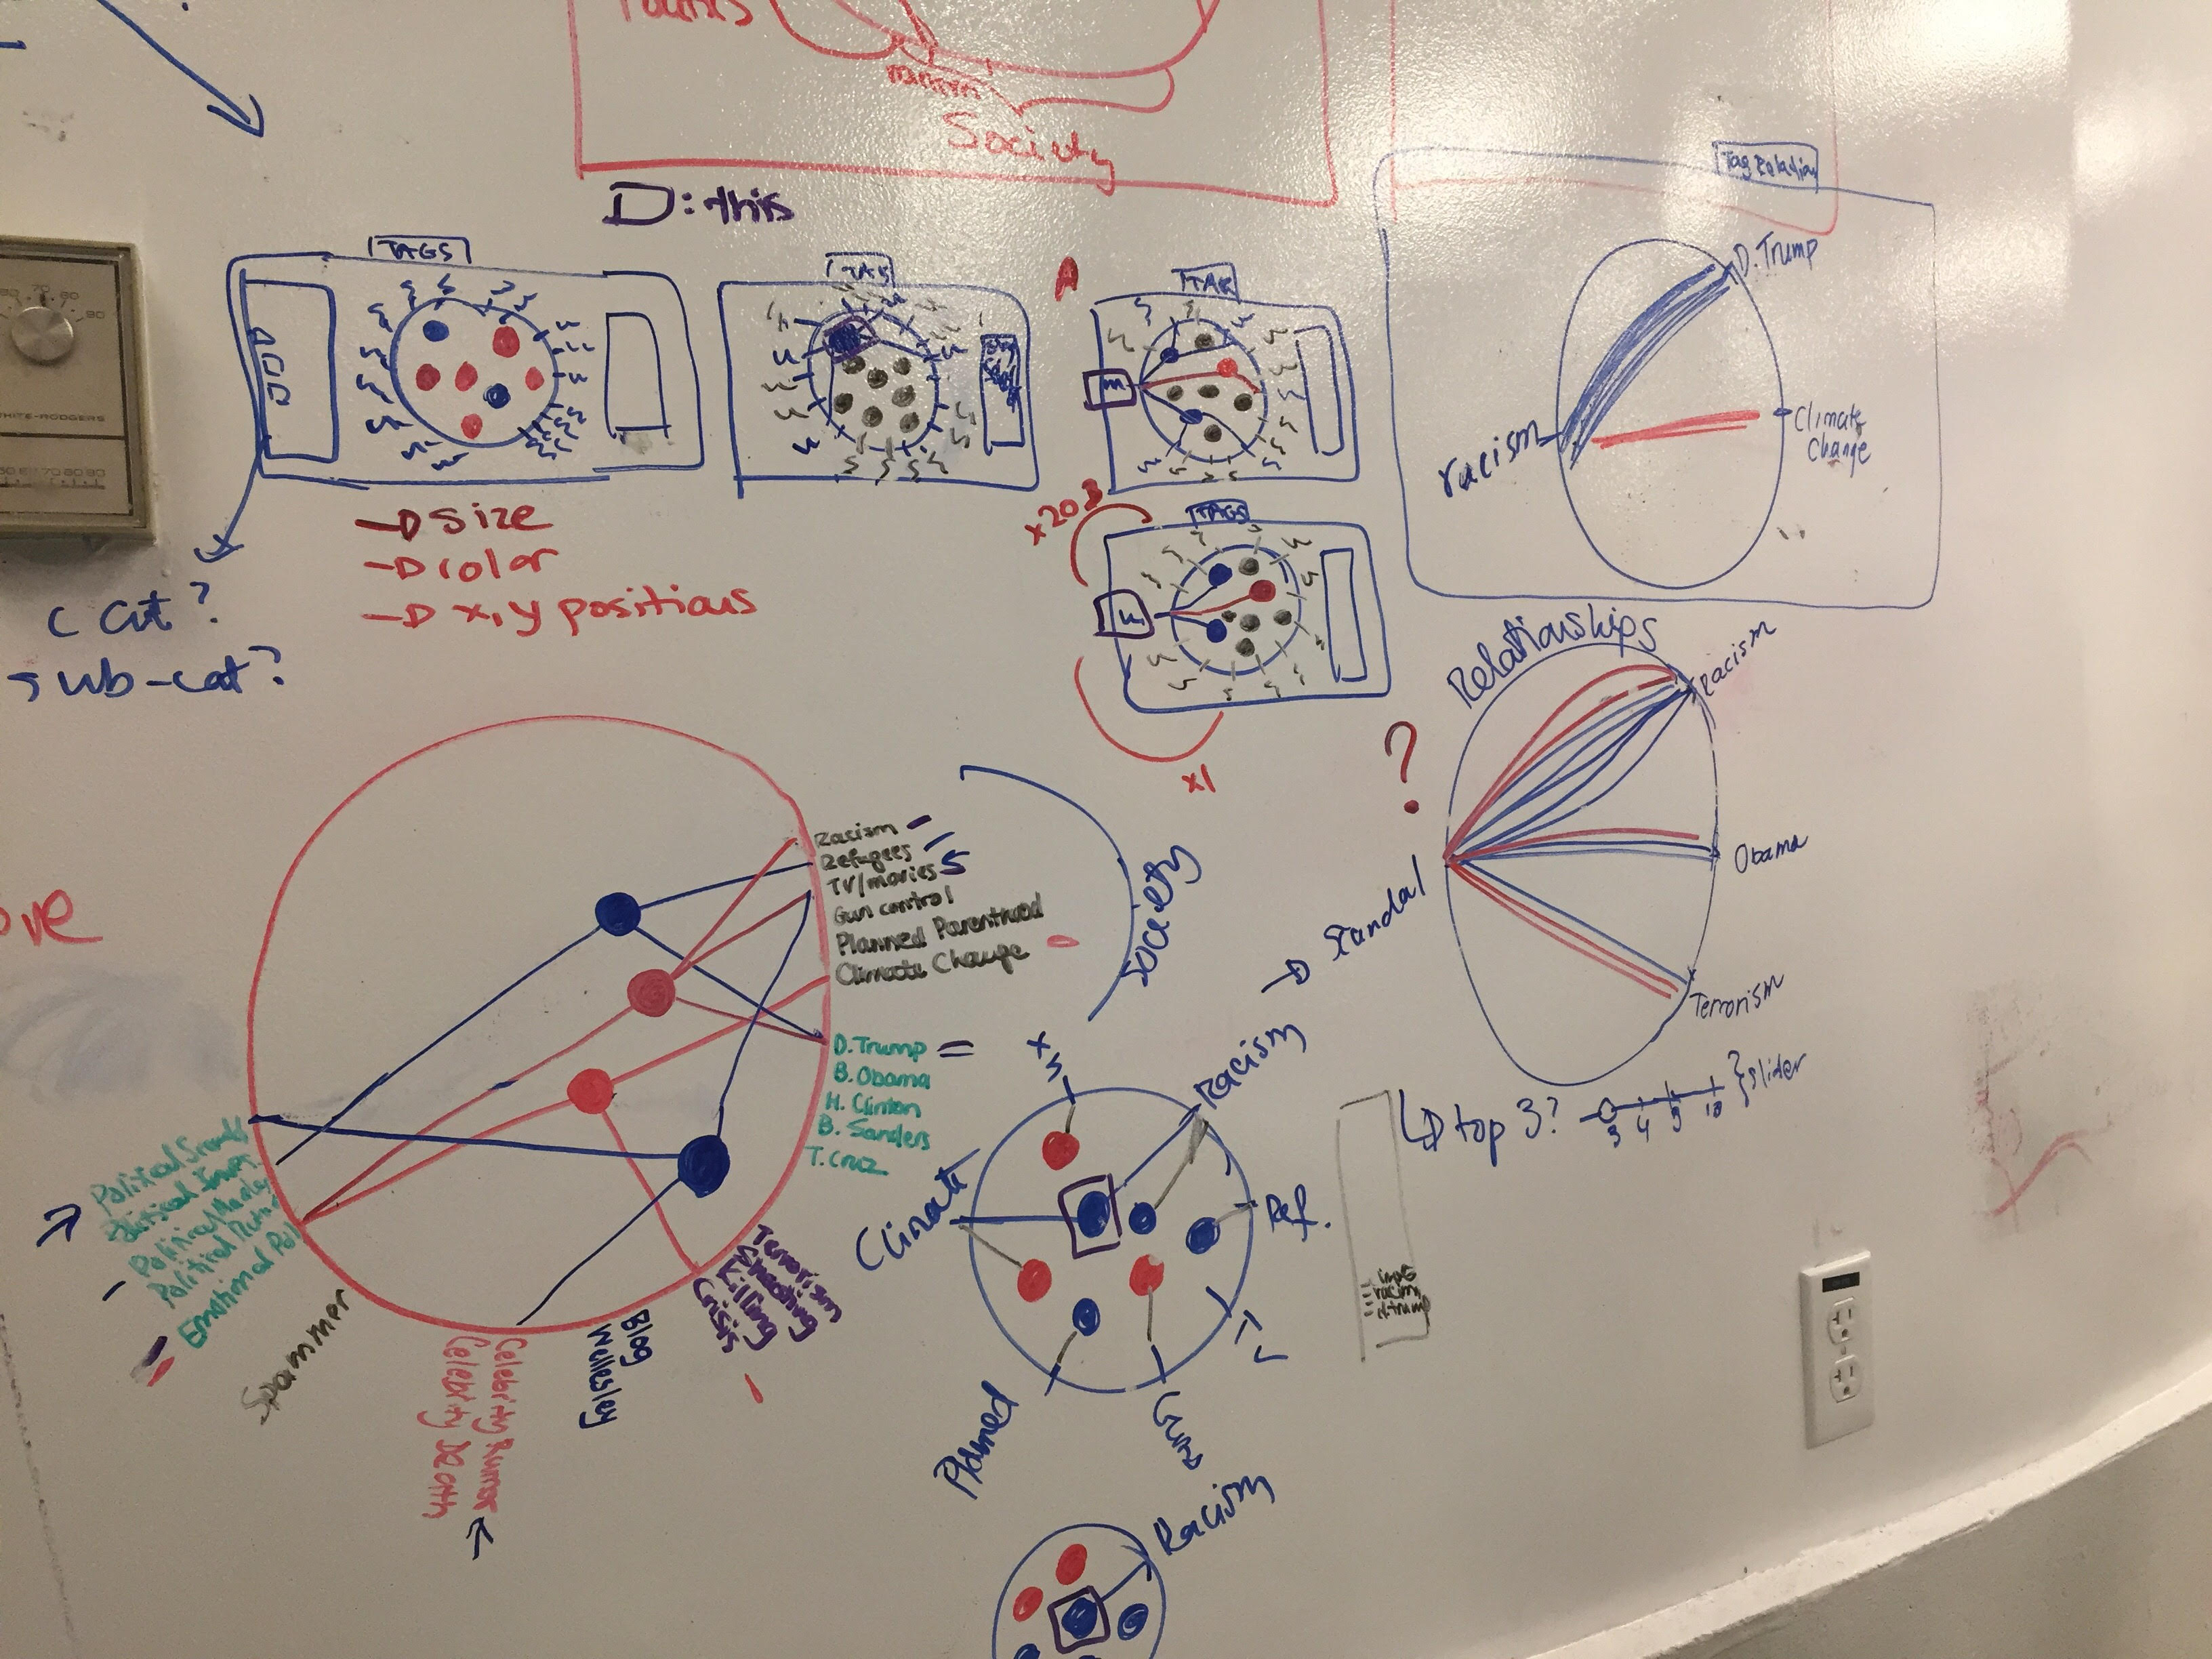
Figure 3. Brainstorming sketches of a new visualization
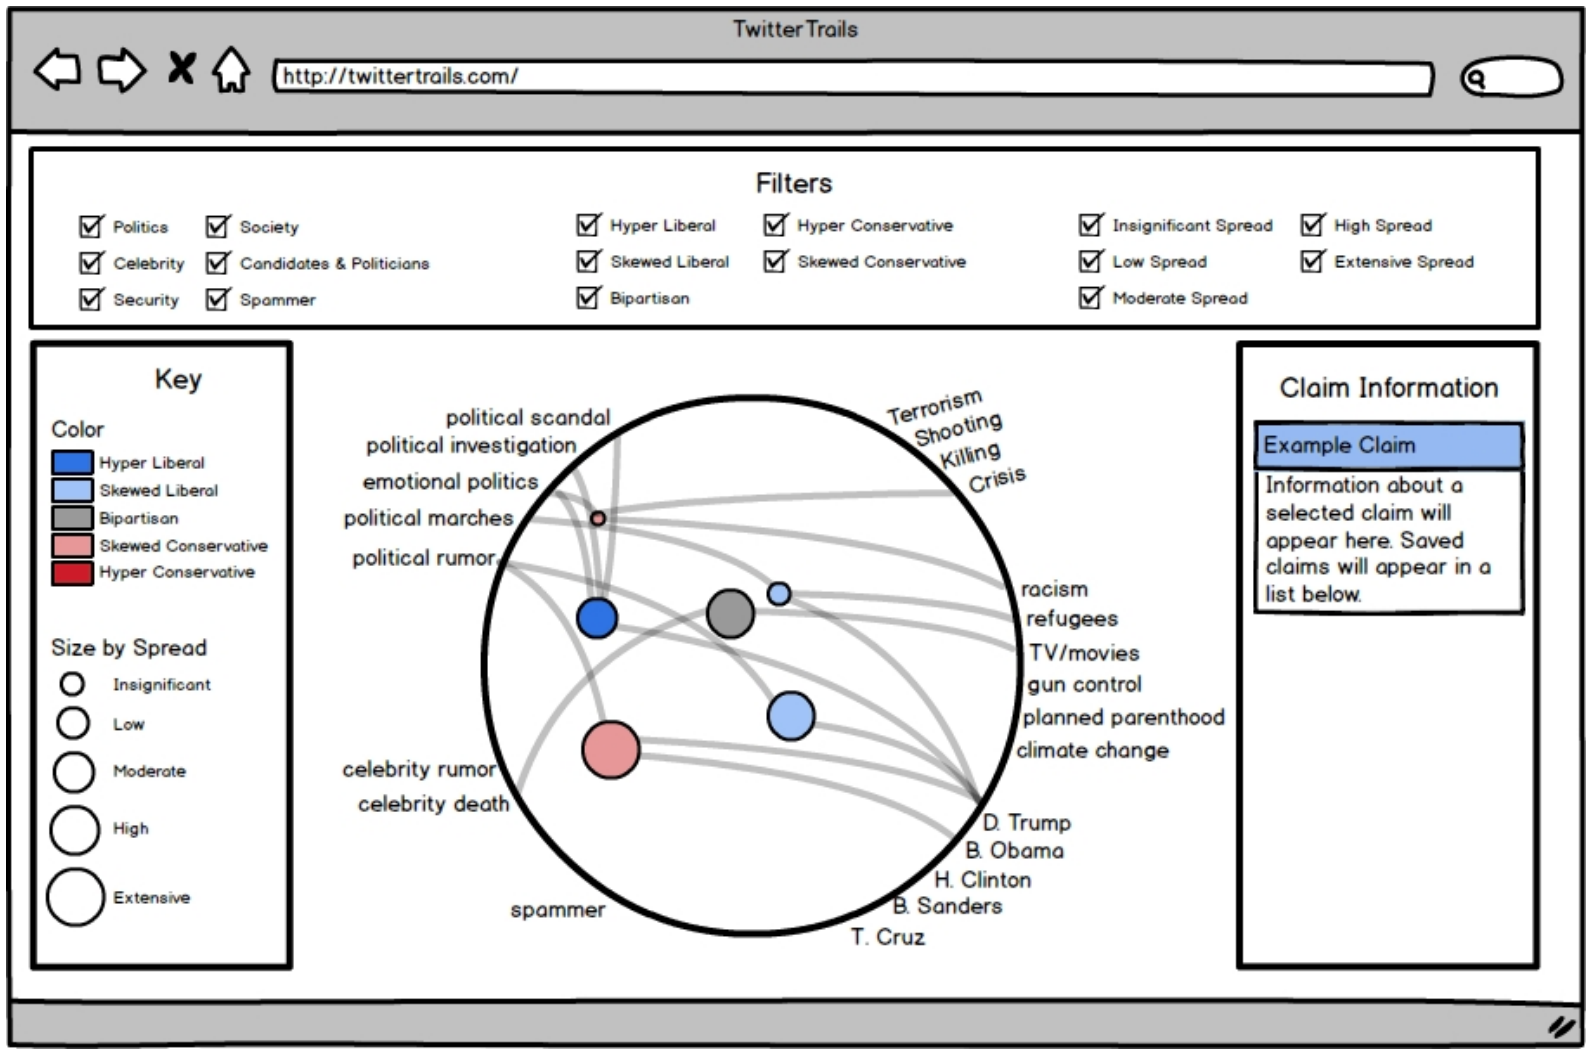
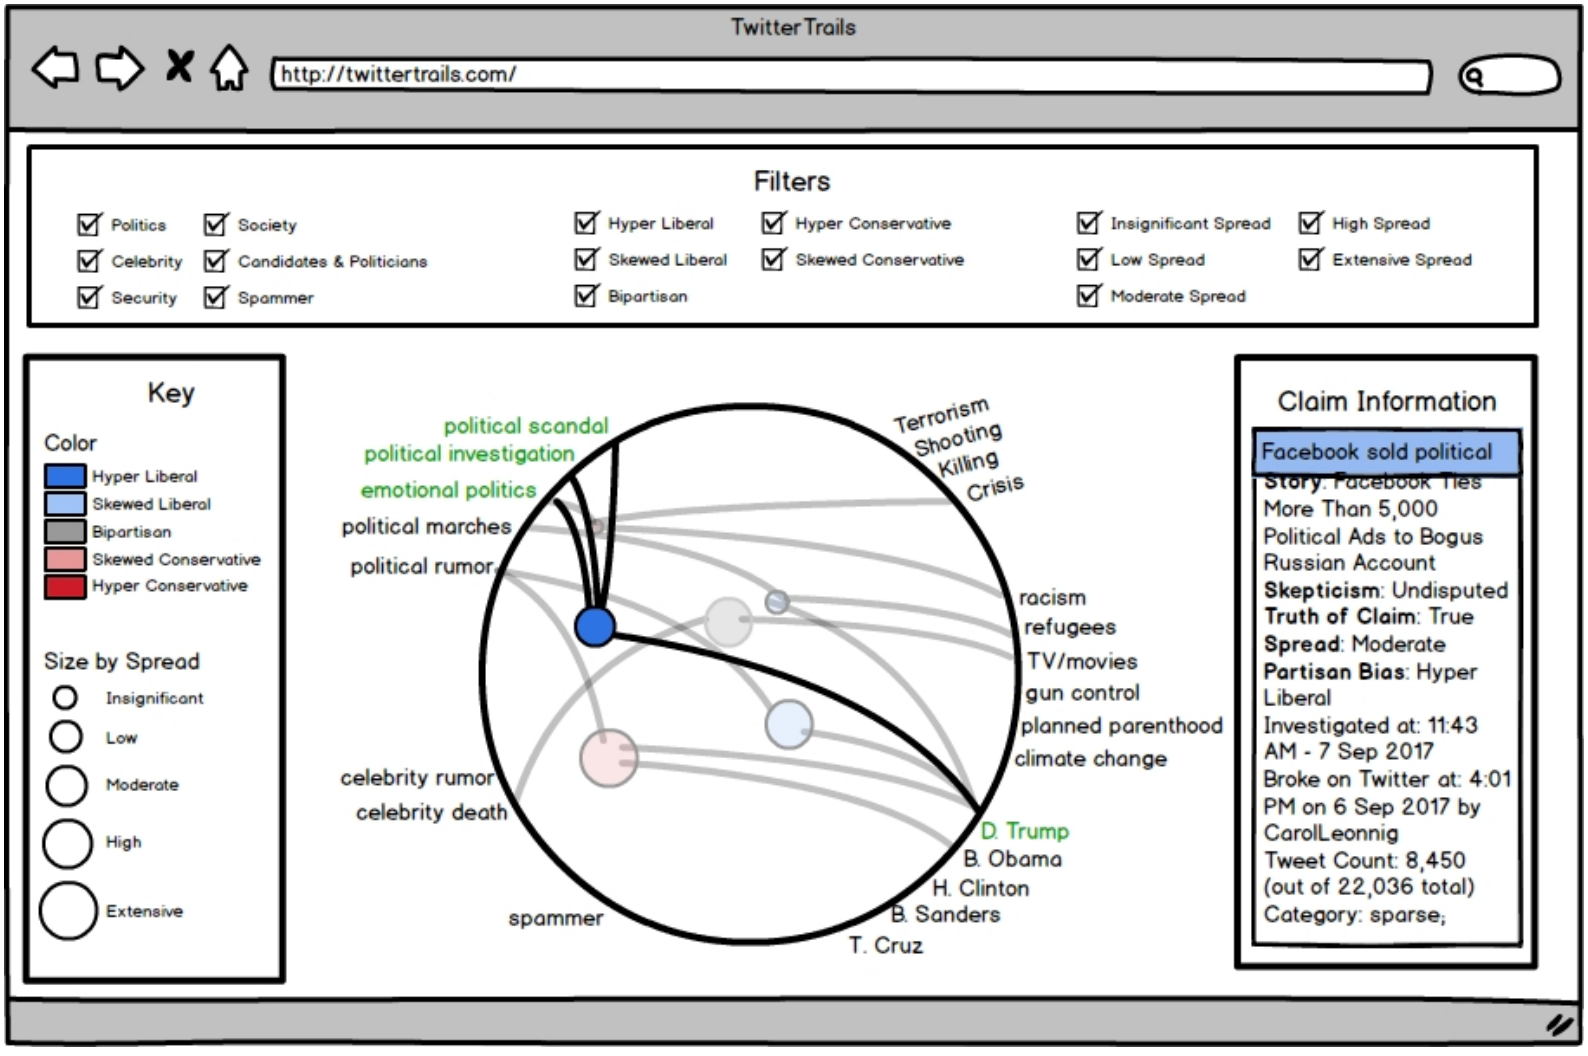
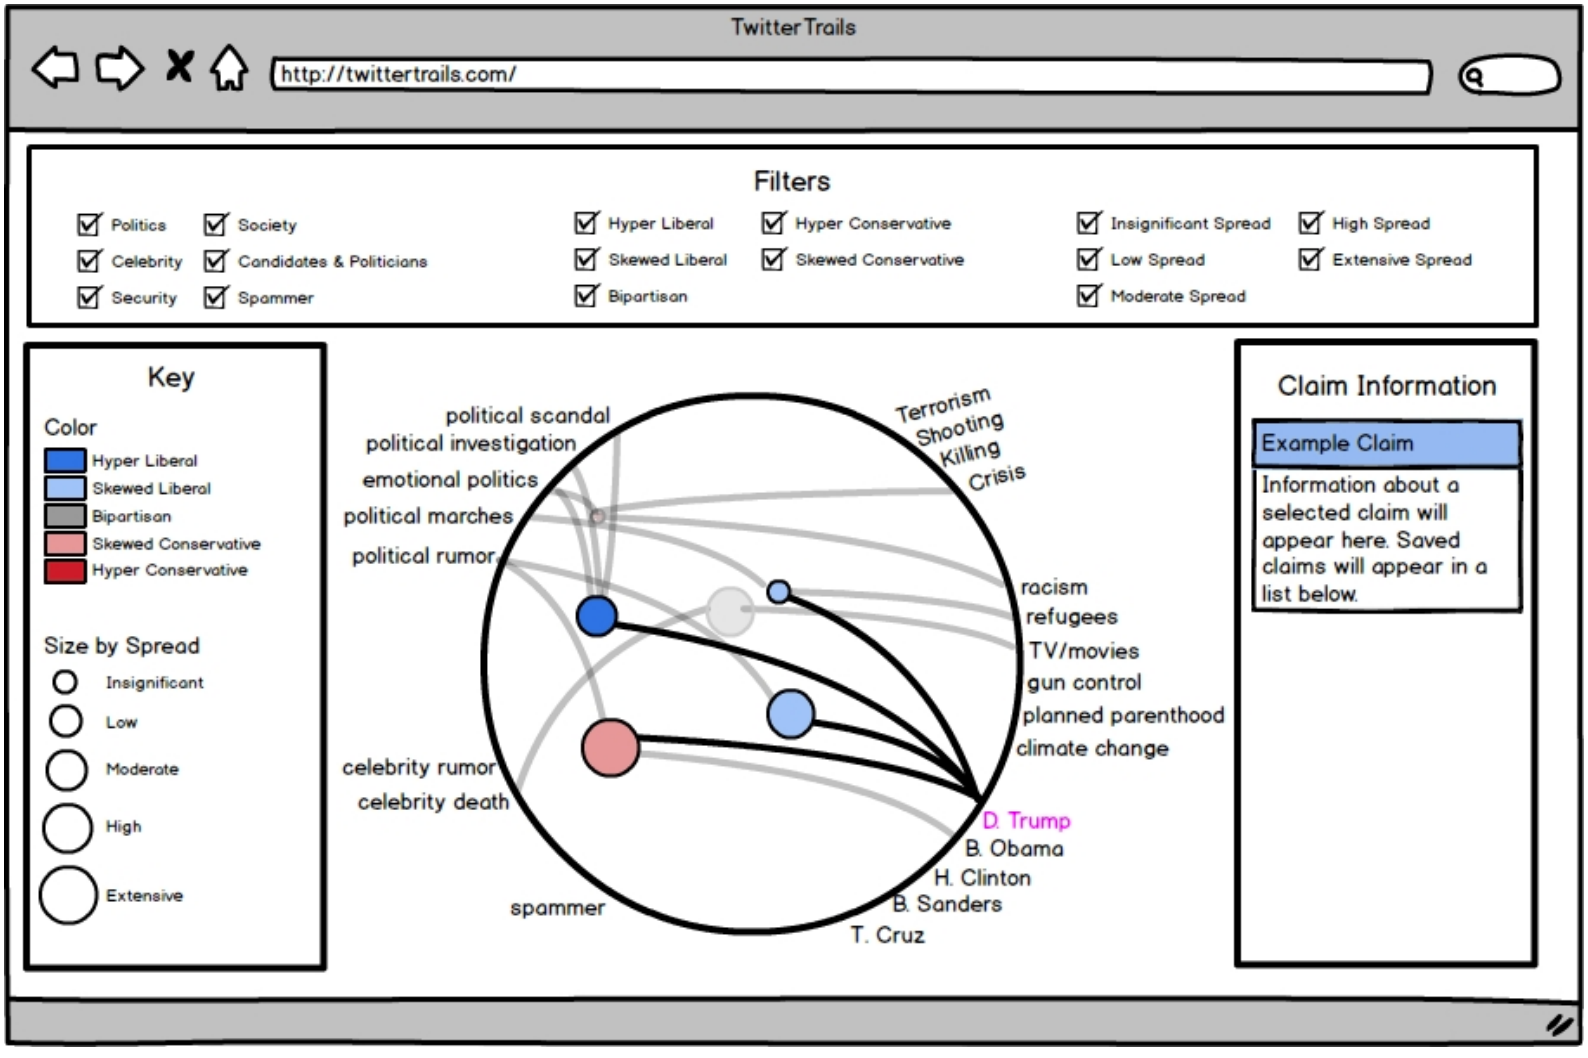
Figure 4. Mockups of a new visualization
This research is ongoing. To find out more about about the overall TwitterTrails project, click here.
Publications/Conferences
C. Pollalis, C. Grevet, L. Westendorf, S. Finn, O. Shaer, P. Metaxas. Classroom Activity for Critical Analysis of News Propagation Online, Case Study, Proc. CHI 2018. (45% acceptance rate)