Personal Genomics for HCI
Role: Project Manager
- Design and develop an interactive D3.js visualization tool using HTML, CSS, and JavaScript
- Conduct iterative user-centered design and run 100+ MTurk usability studies
- Analyze the qualitative and quantitative data gathered from users to draw conclusions and improve the tool
- Guide undergraduate researchers through the user experience process and lead the qualitative data analysis
- Co-authored the full paper published at the top-tier CHI 2016 conference (23% acceptance rate)
Collaborators: NYU, Harvard PGP, Open Humans
Time Frame: May 2015-Now
This project is funded by the National Science Foundation.
Project Brief
Questions about how people make sense of and engage with their personal genomic information, and how comfortable they feel about sharing it in order to advance scientific and biomedical research, are not only of paramount importance for society and policy makers, but also a pressing issue for HCI researchers. Funded by the National Science Foundation, and in collaboration with the Harvard Personal Genome Project, we investigate how to design effective interaction techniques to empower nonexpert users to engage with their personal genomic information. This research is in progress.
Problem Statement
While the number of people who get their genome map exponentially increase, the representation of their data is still delivered in table format. This table format makes it extremely difficult for people to explore and understand their data. As such, there is a need for a better visualization that empowers users to explore, understand, and compare their genomic data.
To achieve these goals, we created GenomiX, which is a novel tool for self-exploration of personal genomic data. Using data from the Harvard Personal Genome Project (PGP), GenomiX creates a unique and interactive gene variants report, which can be explored visually as an overview graph (Figure 1, Figure 2) or by health category. GenomiX report can be used together with a Chrome extension to collect and store information about your gene variant report. We are currently in the process of creating a comparative visualization, where users can compare their data.
Understanding the user
Before starting the design process, we needed to understand who this tool was aiming to help. We conducted qualitative studies to understand Personal Genome Project users’ motivations, needs, information practices, and concerns in engaging with and sharing their personal genomic information. Our findings indicated that searching, exploring, comparing, sharing, and organizing data are fundamental to users’ understanding of personal genomic data.
Our aim was to create a user interface that allows users to do all the above and empowers them in the process of exploring and understanding their personal genomic data. We conducted a series of experiments through Amazon Mechanical Turk to investigate how variations in user interface design affect non-expert users’ understanding of personal genomic reports and consent processes. An experiment with non-expert users demonstrated that interactive and visual design interventions improve the understandability of personal genomic reports for consumers. In particular, results showed that a new interactive bubble chart visualization designed for the study resulted in the highest comprehension and perceived comprehension scores. These scores were significantly higher than scores received using the industry standard tabular reports currently used for communicating personal genomic information. We also investigated the effectiveness of various visualization techniques for enabling exploration of shared and unshared genetic variants among biological family members. We found affording users the flexibility to examine the same report using multiple perspective increases their understanding.
Based on the above user studies, we developed a novel interactive tool, named GenomiX, aimed at empowering users as they engage with their own genomic information (Figure 2).
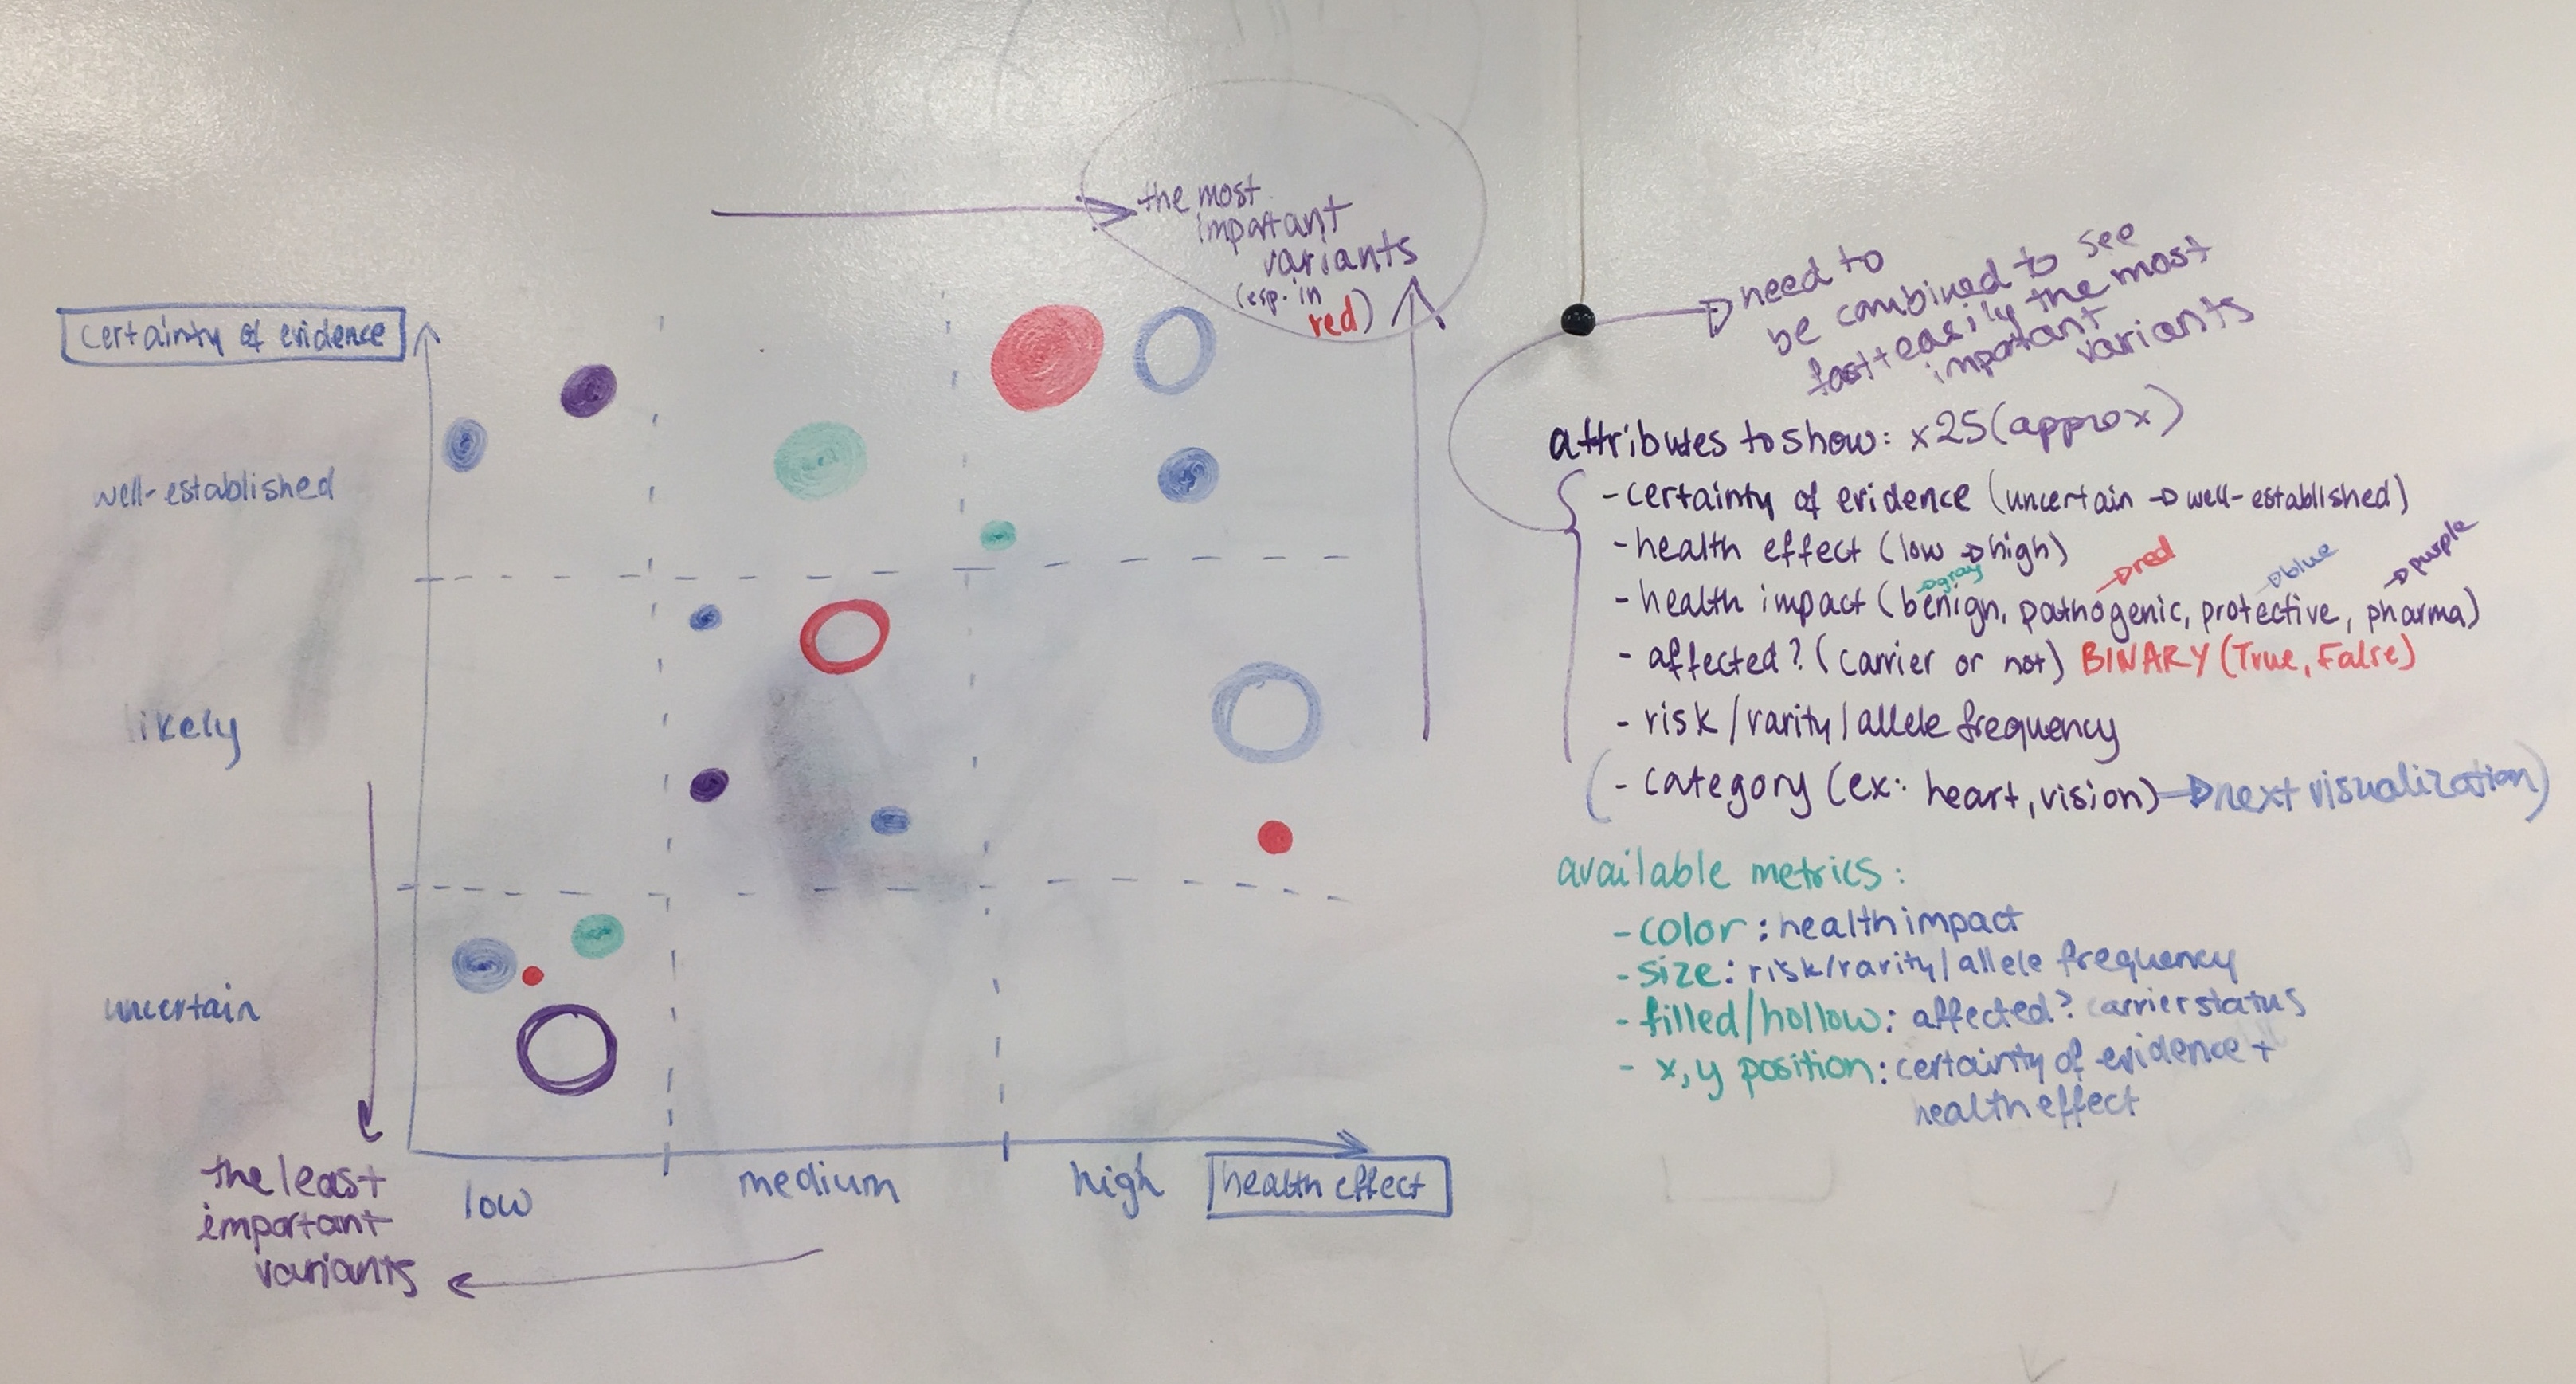
Figure 1. Brainstorming sketch for the overview graph
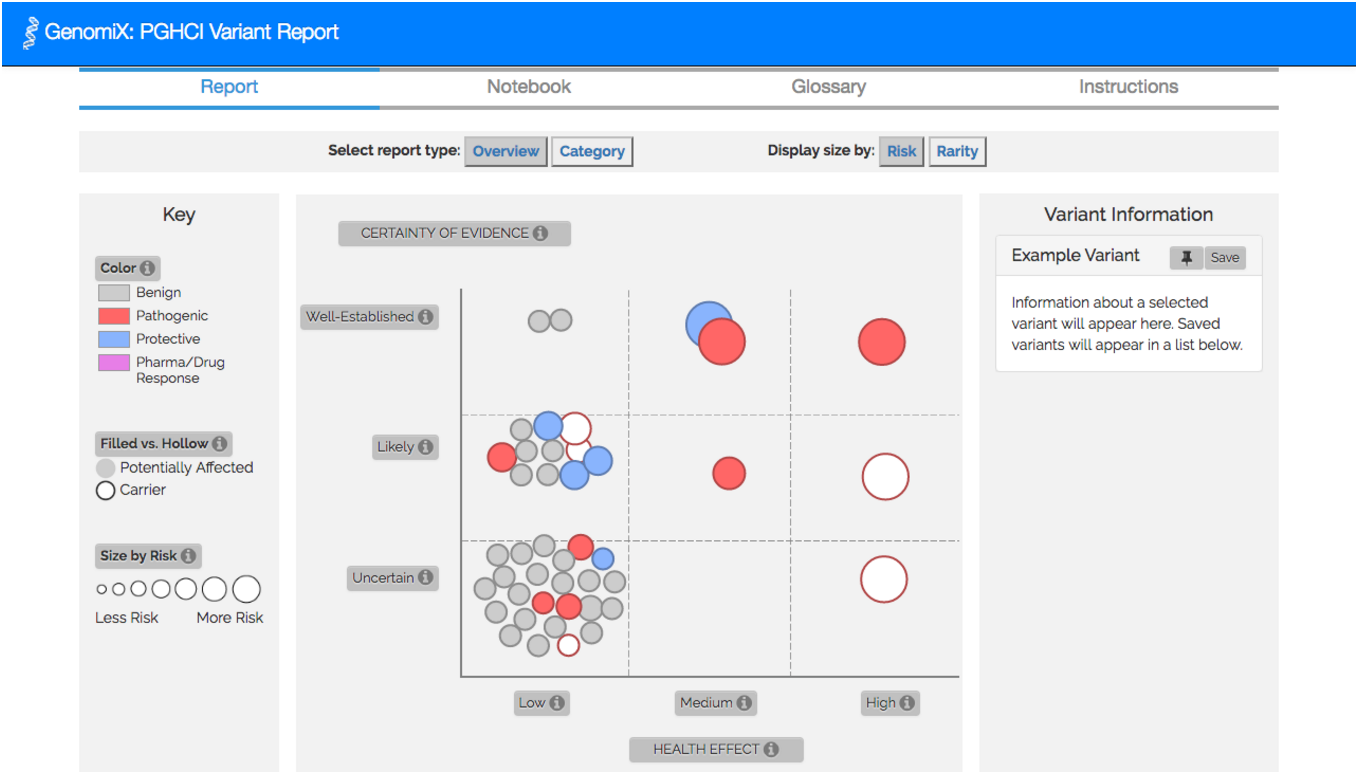
Figure 2. Overview graph view of an example variant report
Evaluation
The evaluation of GenomiX was done with 74 users who had previously participated in personal genome mapping studies, and who had already used industry state-of-the-art reports to view their results. This user group was sought out to evaluate the ongoing interpretation of genomic data, and to understand what new insights participants are able to form about their data compared with the existing tools and reports. Results indicate that GenomiX facilitates understanding and enables non-expert users to derive new insights from their personal genomic information. These findings were presented in the CHI 2016 paper.
Future Work
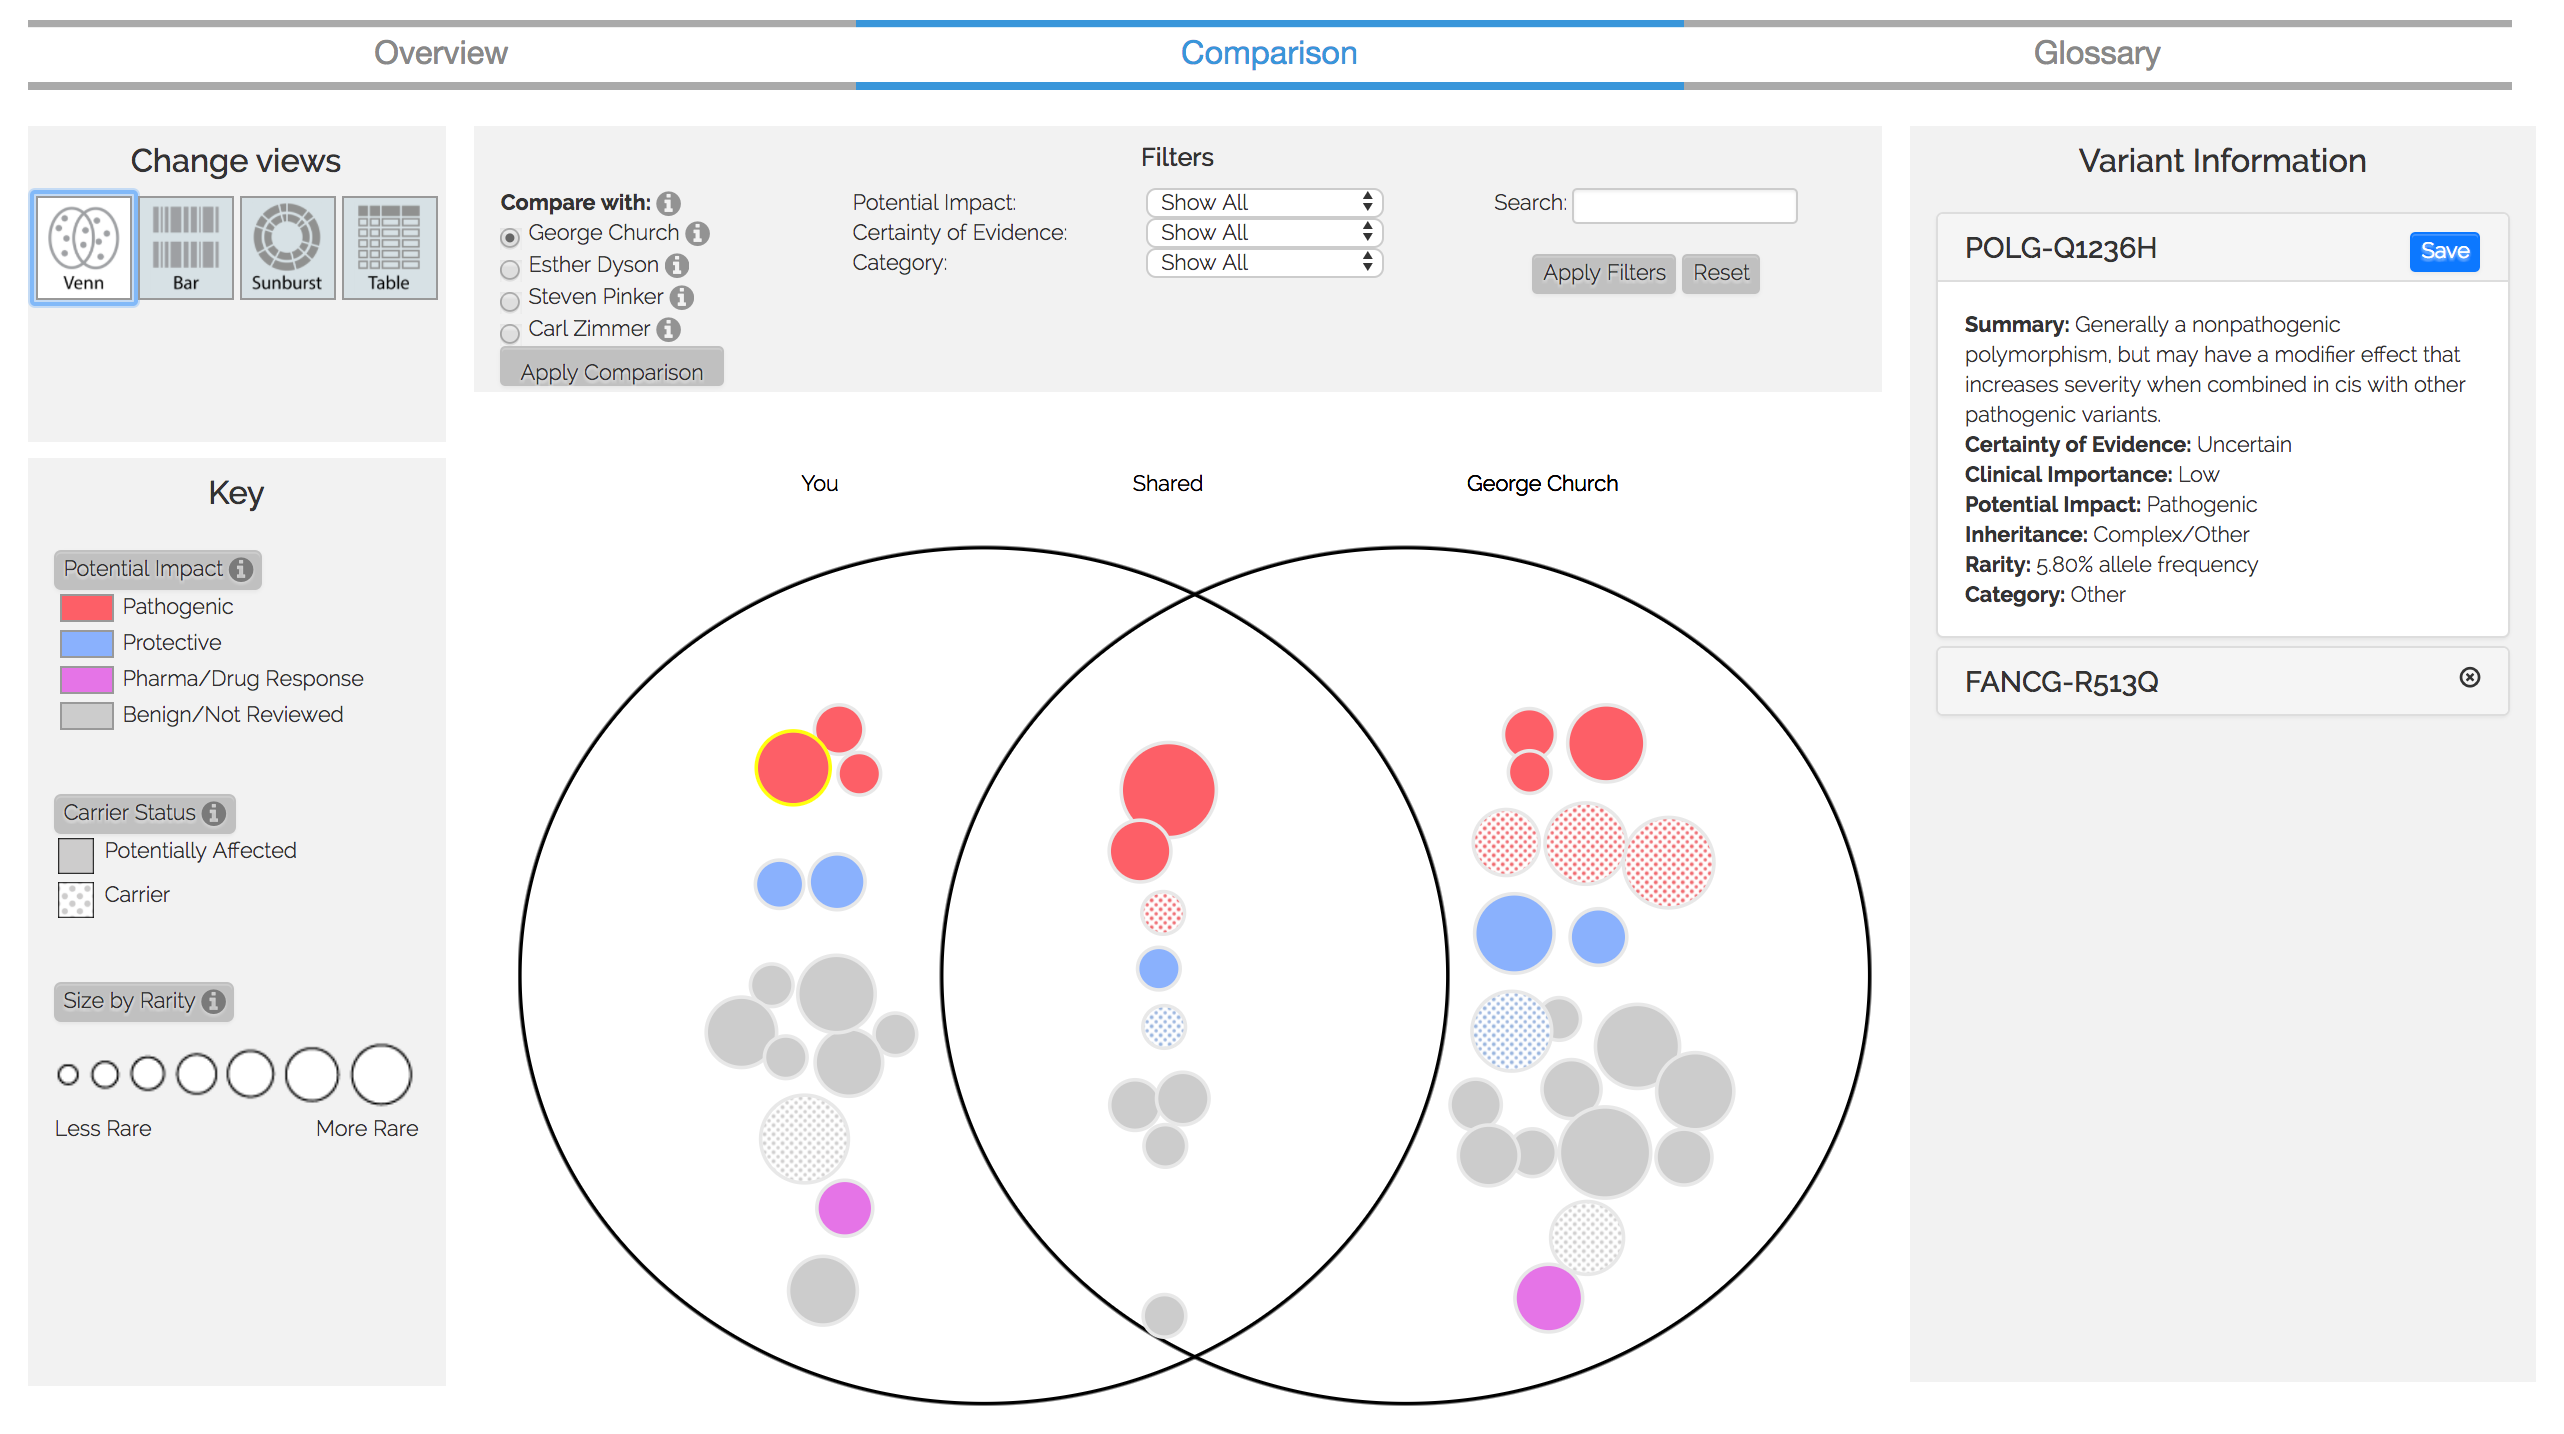
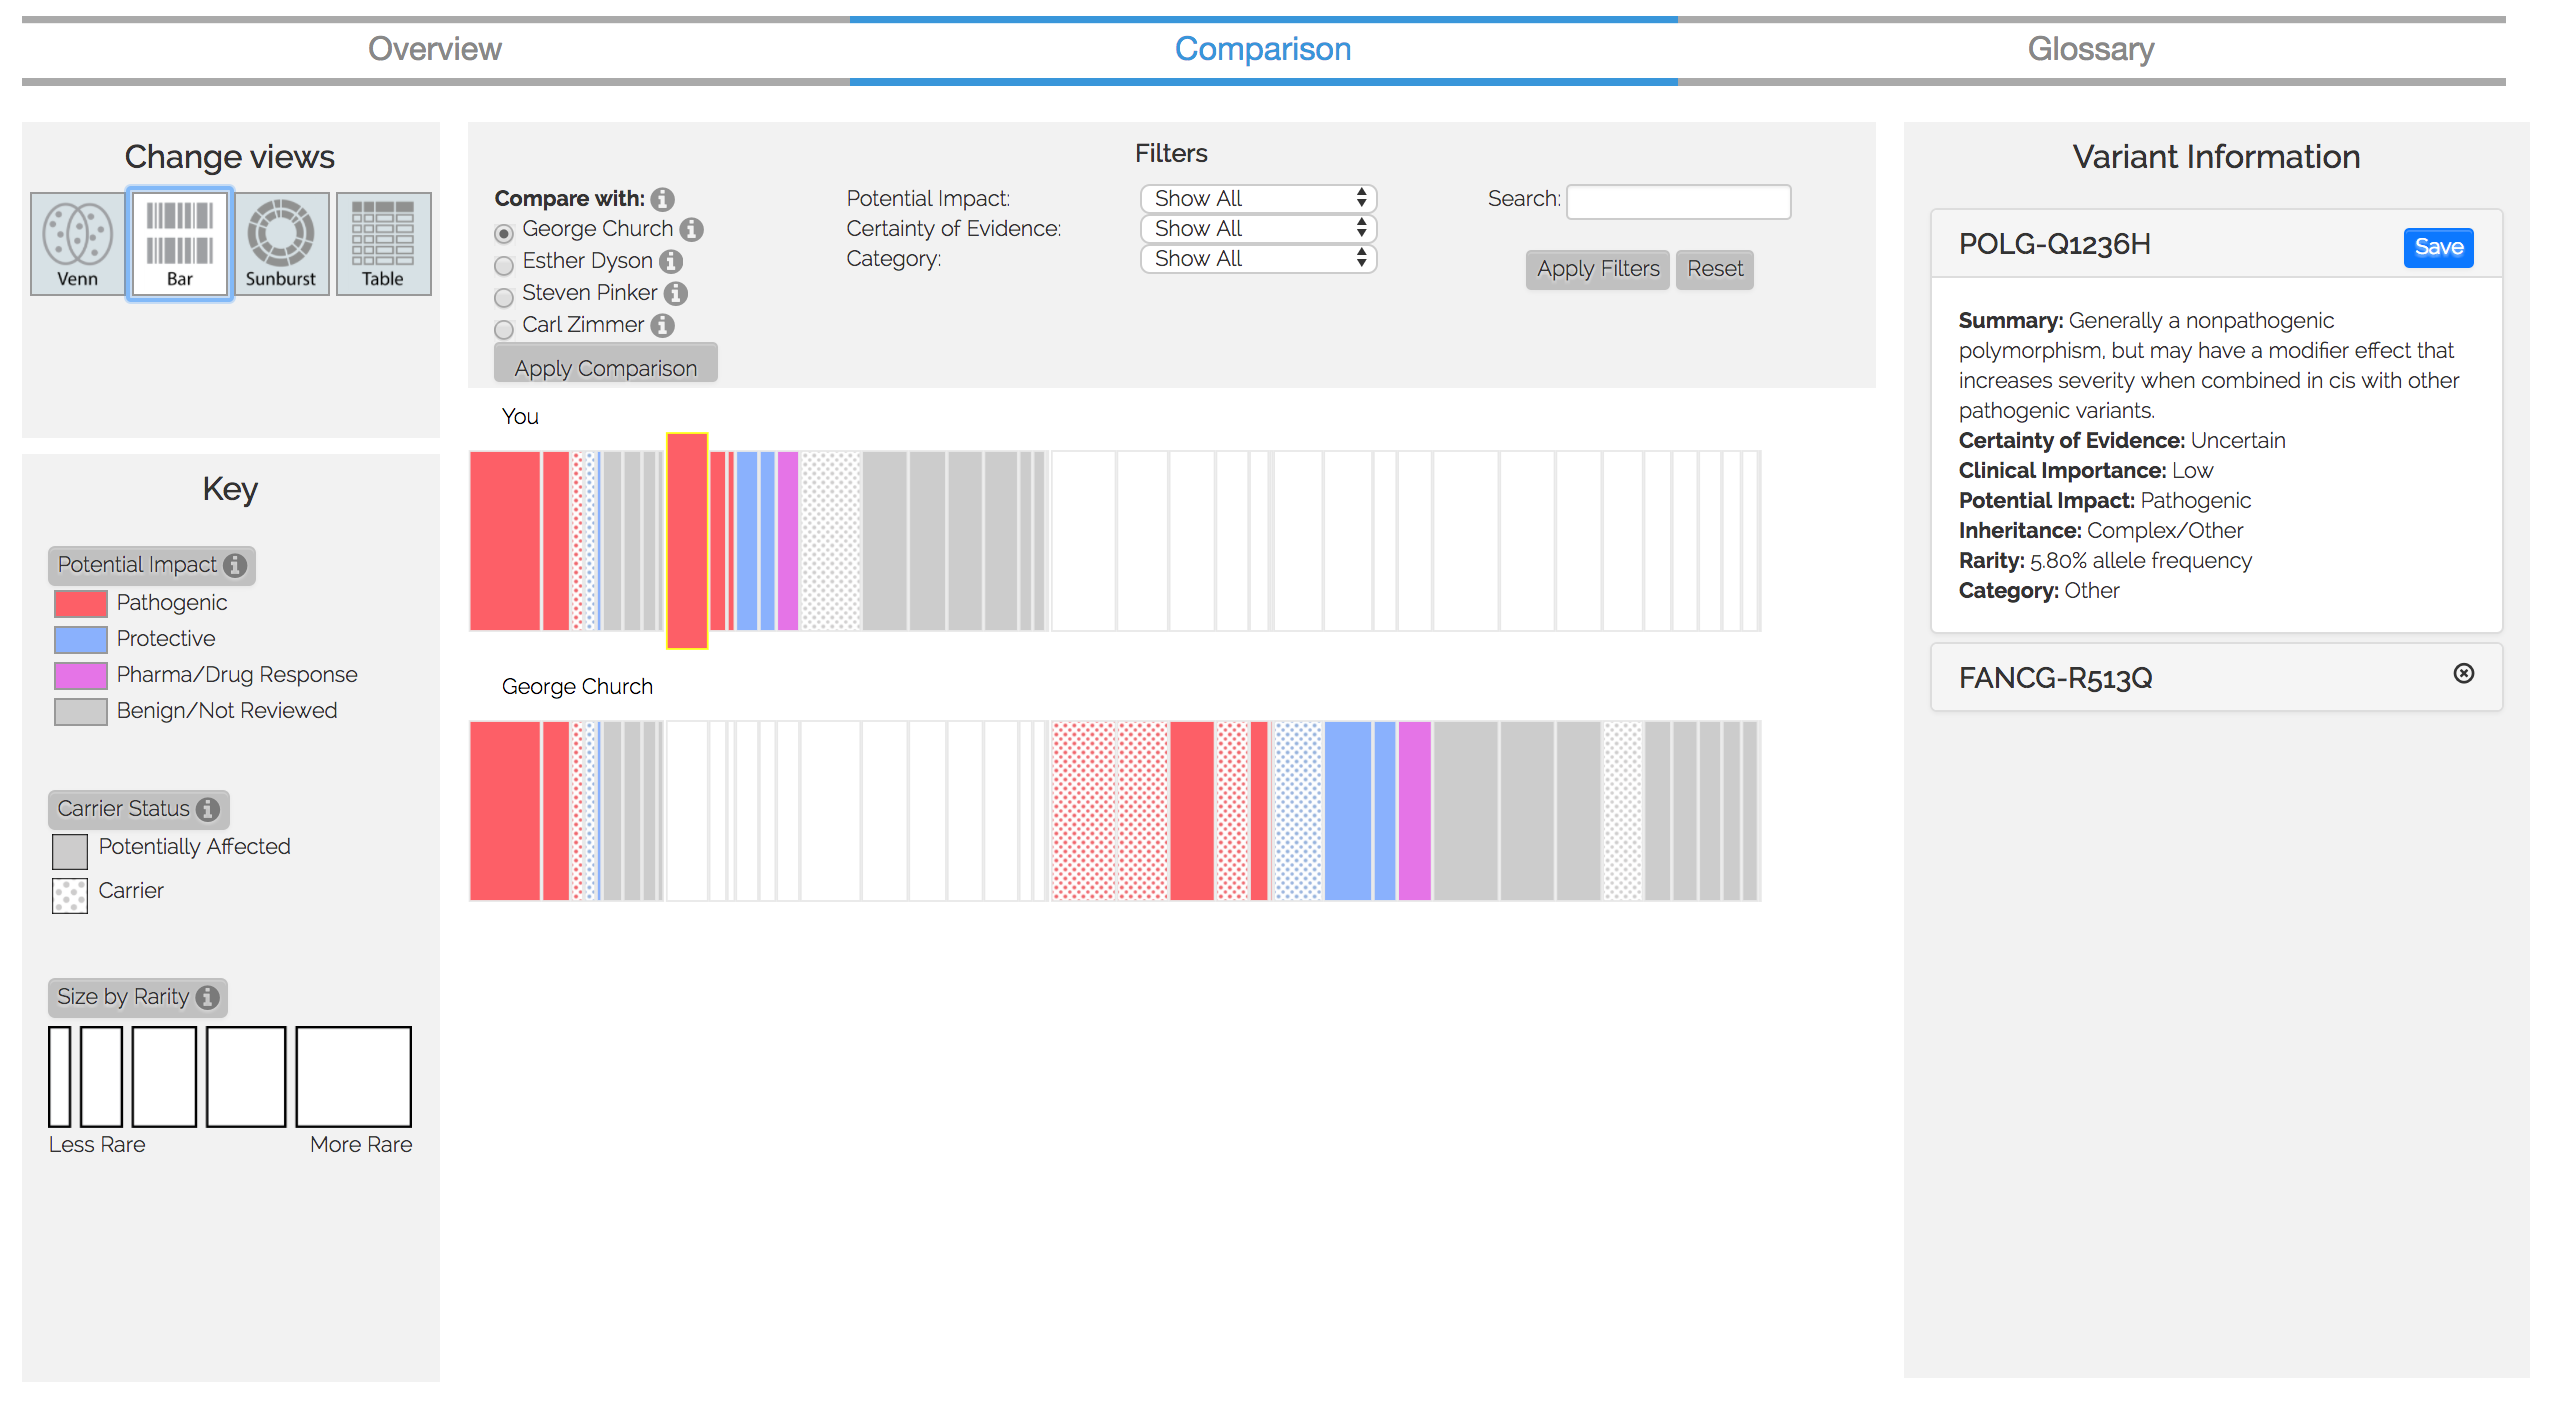
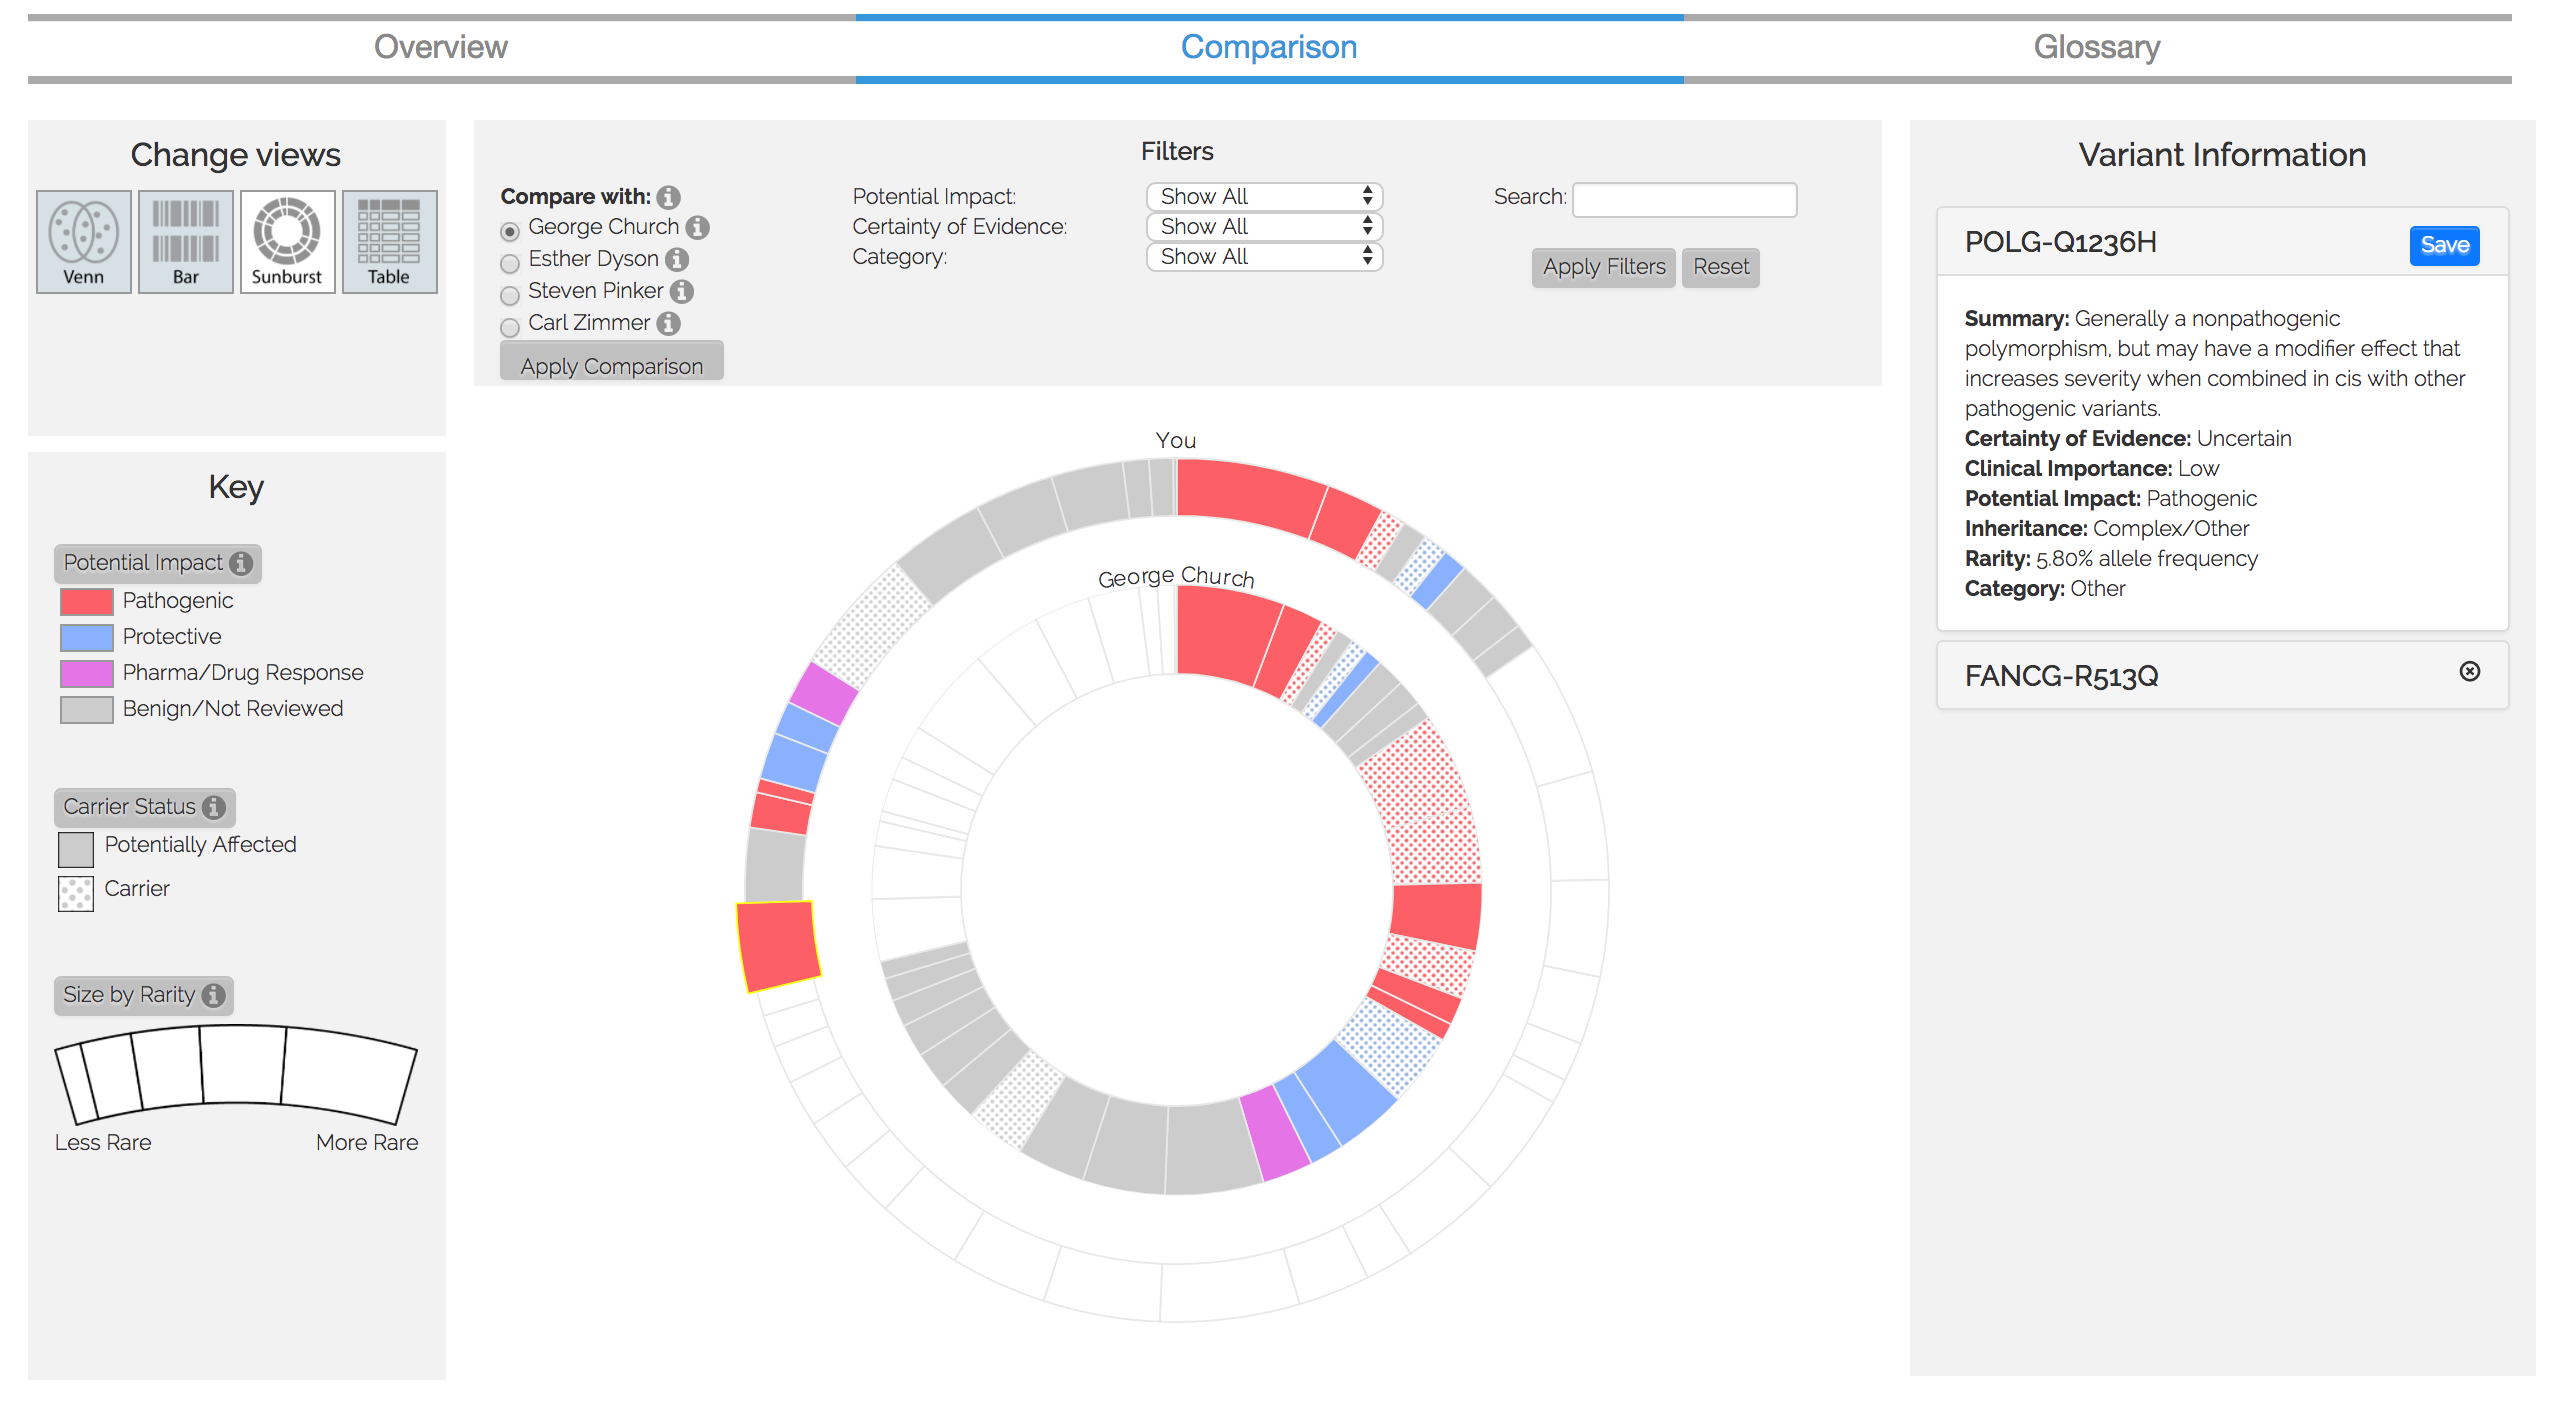
Figure 3. Comparison visualization
We are currently expanding this visualization to compare multiple users' genomes (see Figure 3 or click here for a demo). The development and the data analysis for this comparative tool has been concluded, but the publication of it is pending review.
Publications/Conferences
L. Westendorf, C. Pollalis, C. Verish, O. Shaer, P. Metaxas, M. Ball, O. Nov. From Personal Genomics to Twitter: Visualizing the Uncertainty of Evidence, Workshop Paper, CHI 2017 Computer-Human Interaction.
O. Shaer, O. Nov, J. Okerlund, M. Balestra, E. Stowell, L. Westendorf, C. Pollalis, L. Westort, J. Davis, M. Ball. GenomiX: A Novel Interaction Tool for Self-Exploration of Personal Genomic Data, Proc. CHI 2016 Computer-Human Interaction. (23% acceptance rate)
C. Pollalis, L. Westort. "A Novel Interaction Tool for Self-Exploration of Personal Genomic Data." The Wellesley Ruhlman Conference 2016.
C. Pollalis, L. Westort, J. Davis. "New Human-Computer Interaction Interventions for Personal Genomics." The Wellesley Tanner Conference 2015.
To find out more about about the PGHCI project, click here.